Radial Timeline Template
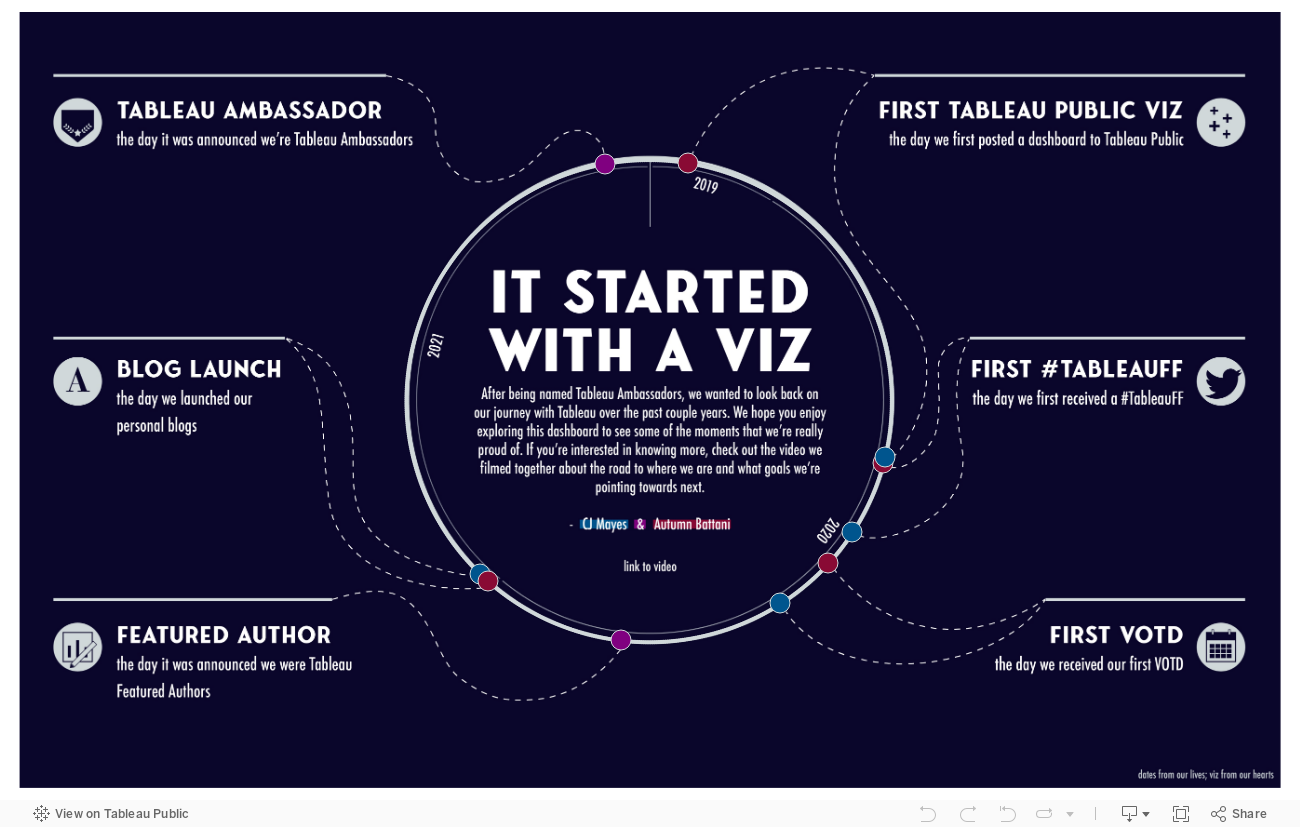
This past week I put out a viz with CJ Mayes looking at the timeline of our journey in the Tableau community. This is something we decided to do after we were named Tableau Ambassadors. We were proud of the accomplishment and wanted to reflect on everything that’s happened along the way. We mapped our first Tableau Public viz, first #TableauFF, first VOTD, being Tableau Featured Authors, and starting our blogs. It can be easy to get caught up in the day to day and forget all the things that have happened to get you there. And because of this, I encourage others to reflect on, track, and visualize their journeys as well (though this template can be used for any circular timeline).
What You’ll Need
The Data
You can find the excel spreadsheet here. It currently has our data in it but feel free to replace it with your own. There are two tabs.
Markers: The markers tab is where you’ll record the events that you want on your timeline. There are columns for Thing (the name of the event), Person (this won’t be applicable if you’re only visualizing data for yourself), the Date it occurred, and a Link.
Dates: This tab is where you’ll put all the dates you want represented in your timeline. I had to play around with how much date padding I wanted to put in to get the spacing that I thought looked good. You’ll want buffer dates before your first point and after your last point to not have them sitting on top of each other in the dashboard. For reference, we included about two weeks before the first point and three weeks after the last point. Next to the dates is a rank of the dates.
The Viz
In the dashboard, you’ll want to [left] join both tabs on their respective date field.
The Calculations
1a. Angle: This makes all the points equidistant from each other. The max rank, as opposed to hard coding the number of points, allows for flexibility so you won’t need to manually update this calc if you need to adjust the number of dates.
360/({MAX([Rank])}-1)
1b. Rank Angle: This multiplie the rank by a constant angle to find the position of each dot.
[Rank] * [1a. Angle]
2a. X: I did not pay nearly enough attention in geometry for me to explain why cosine.
cos(RADIANS([1b. Rank Angle]))
2b. Y
sin(RADIANS([1b. Rank Angle]))
3. X: This allows us to plot just the points that have events separately from the rest of the dates
IF NOT ISNULL([Thing]) THEN [2a. X] END
The View
Place your Y calculation on Columns and both X calculations on Rows with a dual, synchronized axis. Have all pills set to continuous dimensions. Change the mark type for 2a to a line and the type for 3 to a circle. Place the Rank pill on detail as a continuous dimension. Adjust size and color accordingly.

And it’s as simple as that. A huge shoutout to the radial king him self Mr. Circle James Mayes because without him this viz would’ve been a straight line. I hope if you use this you enjoy reliving your journey as much as we did. Can’t wait to see what you make!